Container Details
The Container Details page gives a deep view into a single container — whether it is currently running or has already finished. The page has three sections, each reachable via jump-chips in the sticky header: Info, Metrics, and Logs.
Sticky header
Section titled “Sticky header”- Back button — Returns to the previous page.
- Status chip — Shows Running (green) or Finished (grey).
- Container name (and external ID if available).
- Section chips — Click Info, Metrics, or Logs to scroll to that section.
- Date range picker — Controls the time range for metrics and logs. Defaults to the container’s start time → now (if running) or start → finish (if finished). A special “Container start → Container end” preset is available.
Info panel
Section titled “Info panel”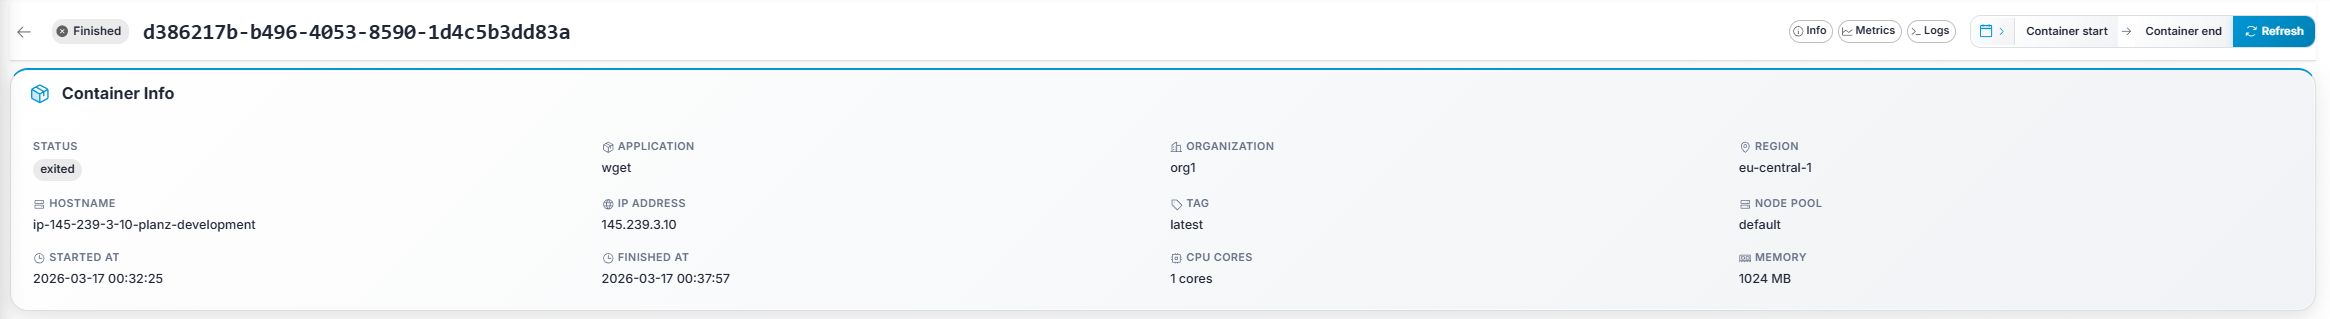
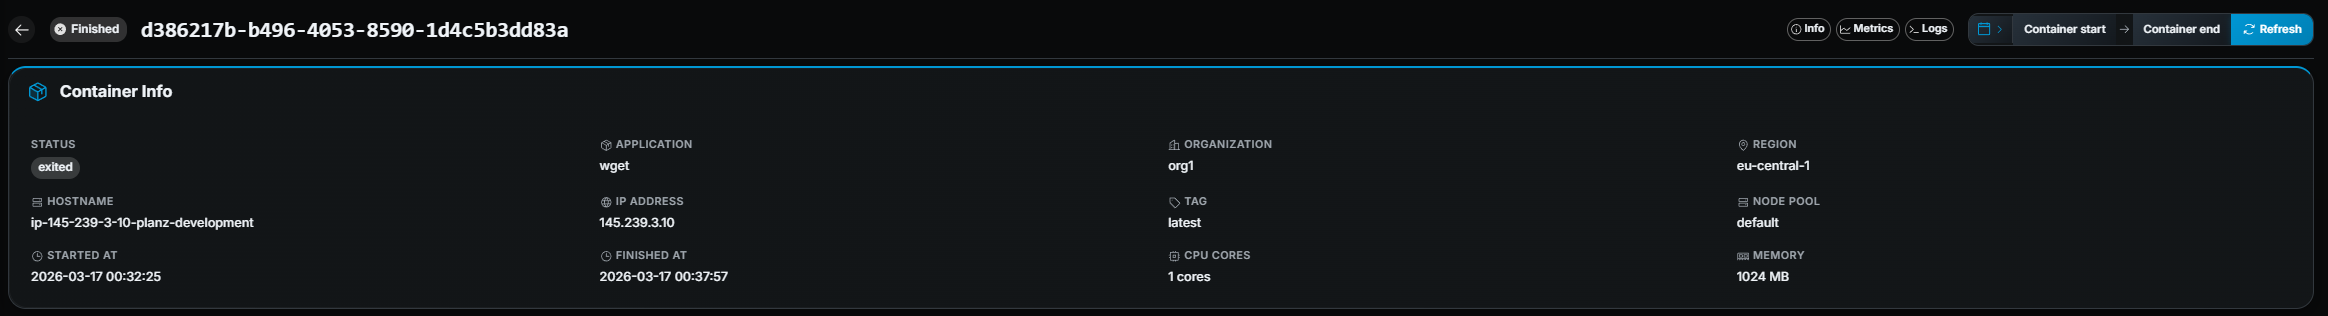
Displays key metadata in a grid:
| Field | Description |
|---|---|
| Status | Running / Finished. |
| Application | Application name. |
| Organization | Owning organization. |
| Region | Where the container is running. |
| Hostname | Node hostname. |
| IP Address | Node IP. |
| Tag | Docker image tag in use. |
| Node Pool | Pool assignment. |
| Started At | Start timestamp. |
| Finished At | End timestamp (only shown if the container has finished). |
| CPU Cores | Allocated CPU. |
| Memory | Allocated RAM. |
| External ID | External reference (if applicable). |
| Ports | Mapped port list. |
Metrics
Section titled “Metrics”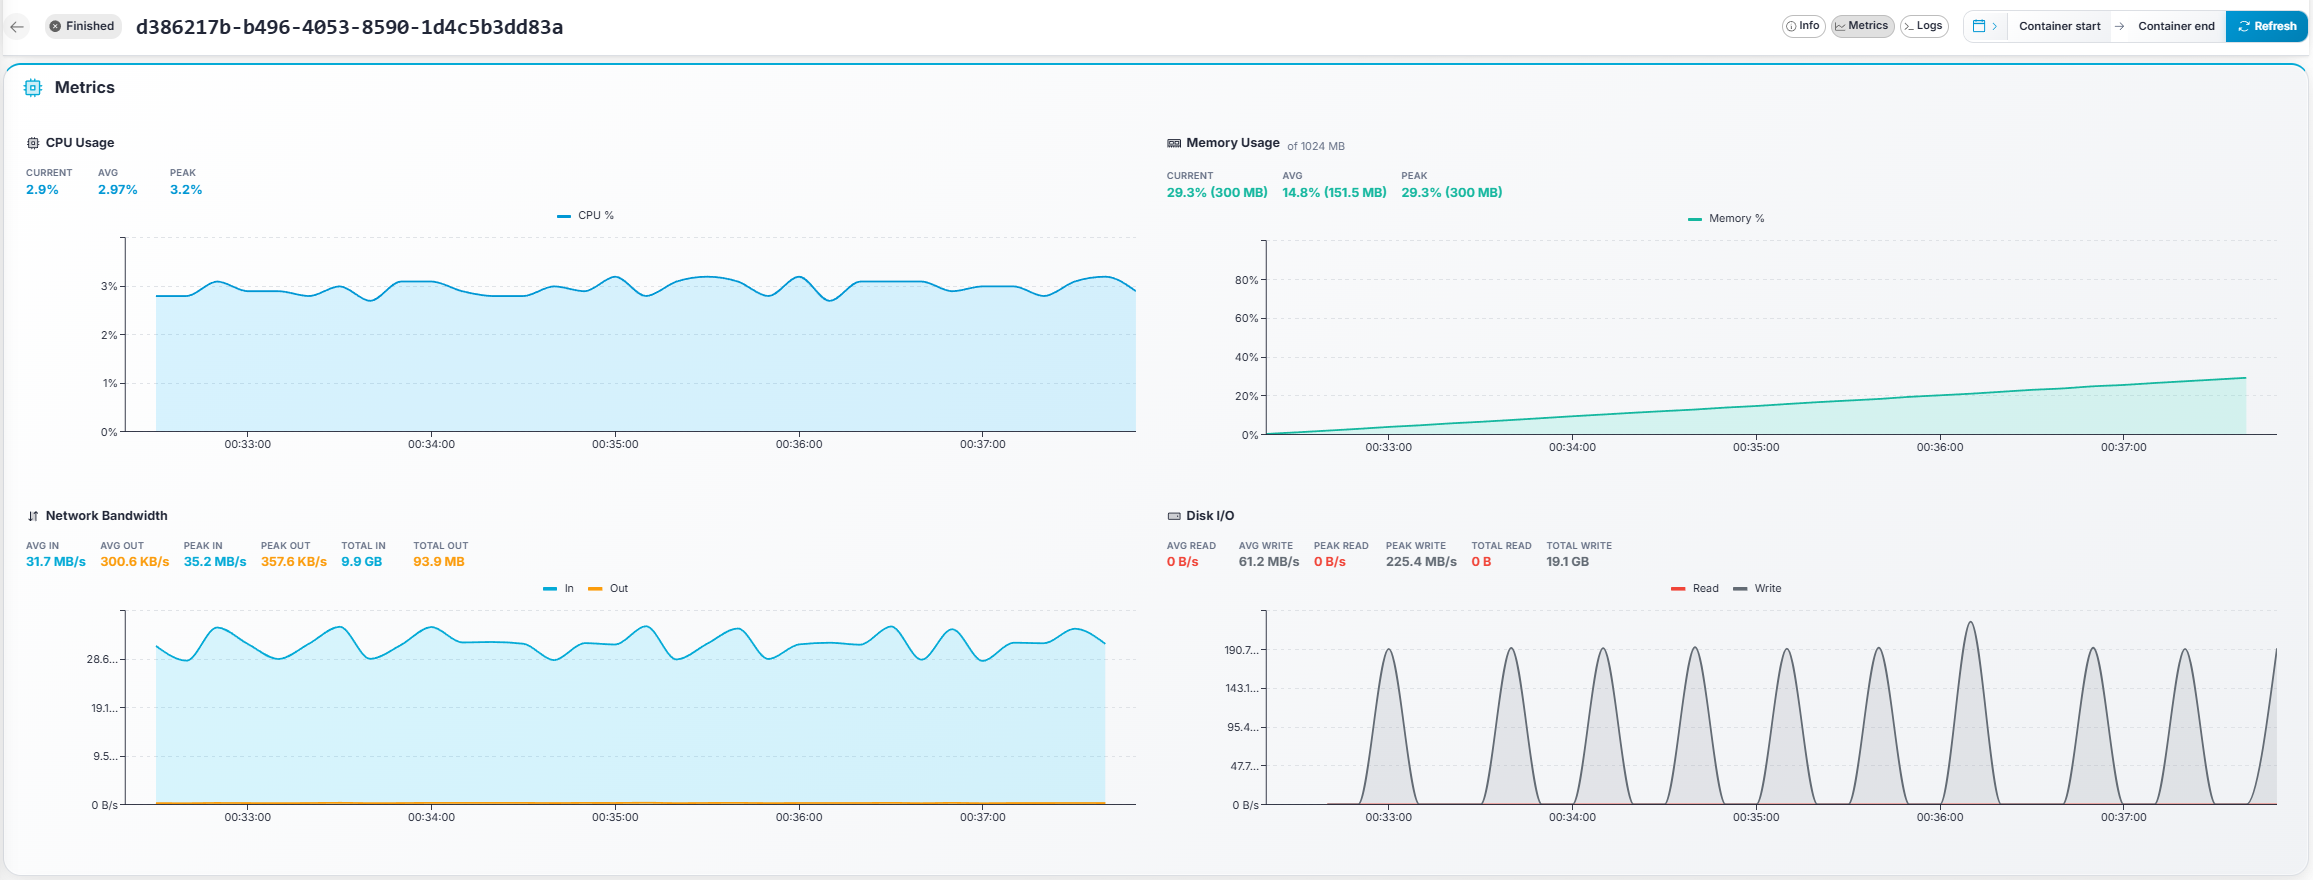
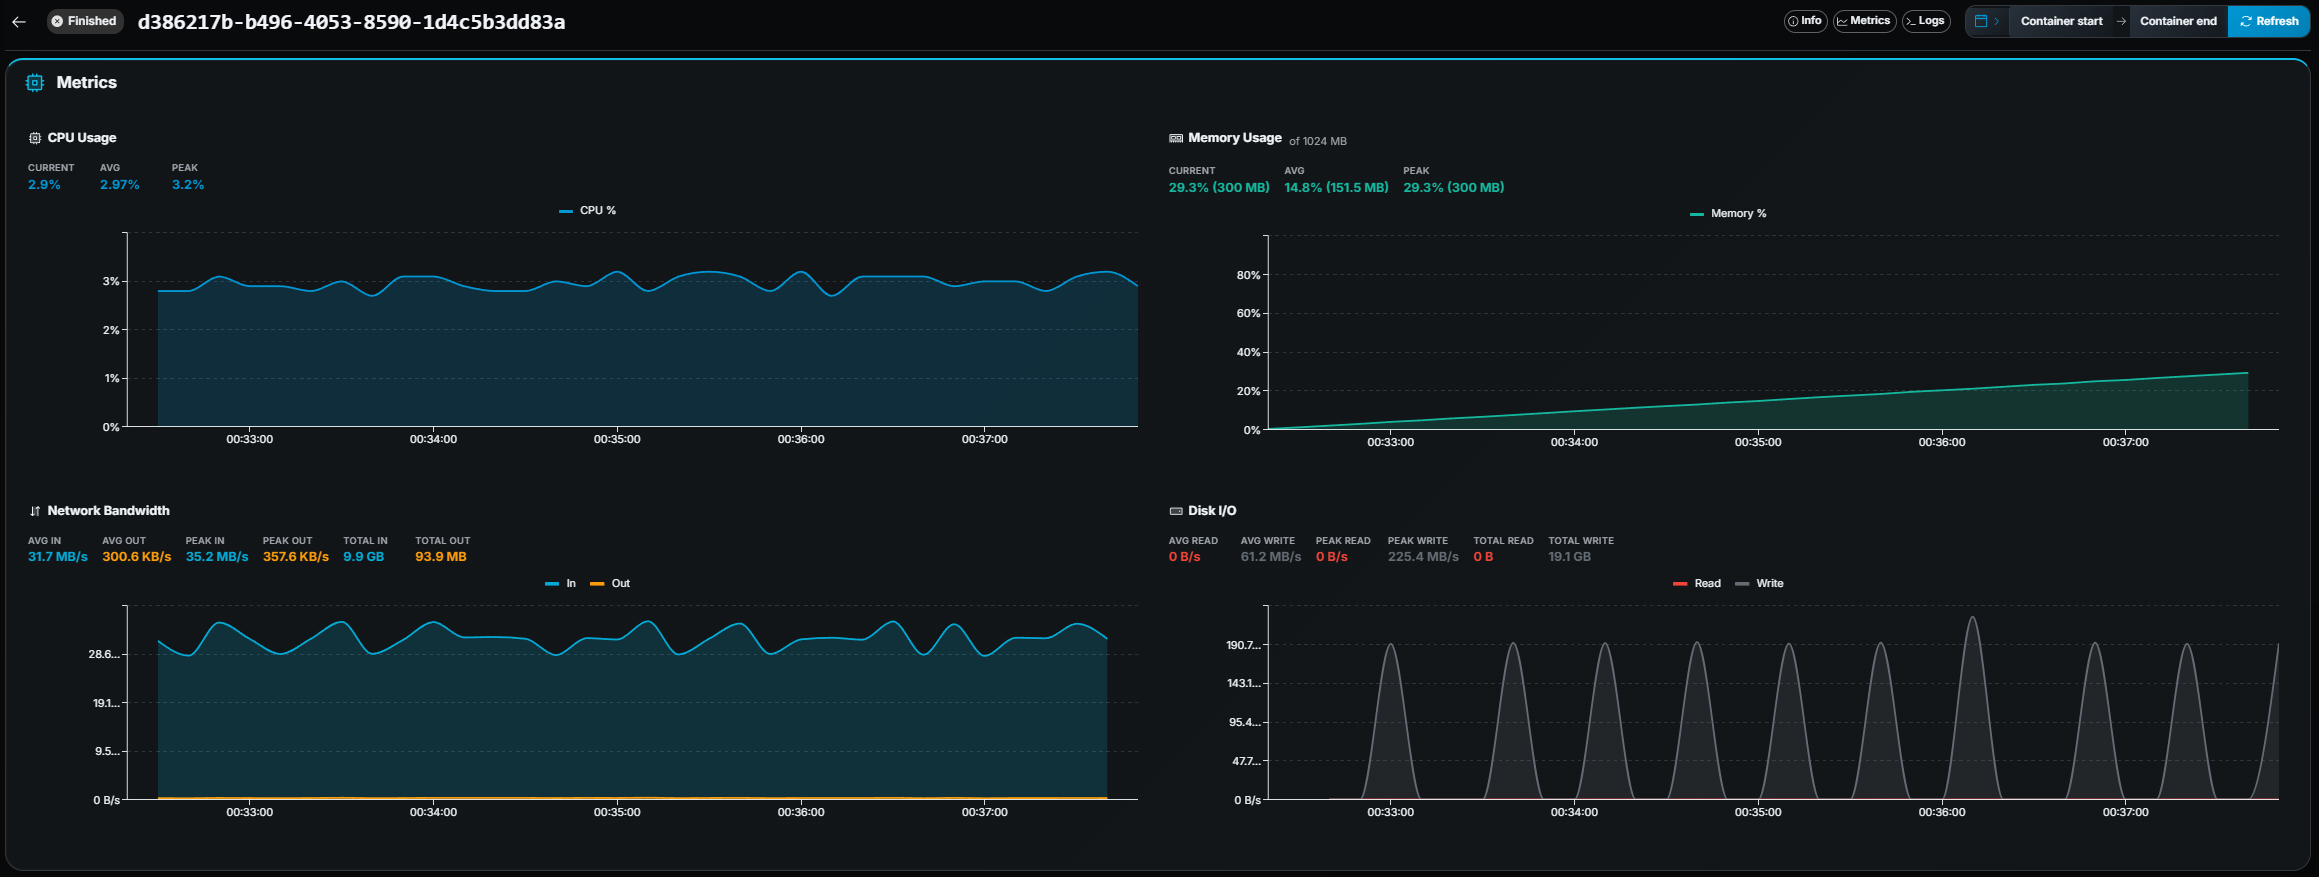
Four interactive line charts with summary statistics:
| Chart | Metrics shown |
|---|---|
| CPU Usage | CPU %, with Current / Avg / Peak stats. |
| Memory Usage | Memory %, with Current / Avg / Peak stats (and MB values when available). Shows the limit if a memory cap is set. |
| Network Bandwidth | In / Out bytes/s, with Avg / Peak / Total for each direction. |
| Disk I/O | Read / Write bytes/s, with Avg / Peak / Total for each direction. |
Brush-to-zoom: Click and drag on any chart to zoom into a time range. The date range picker updates automatically.
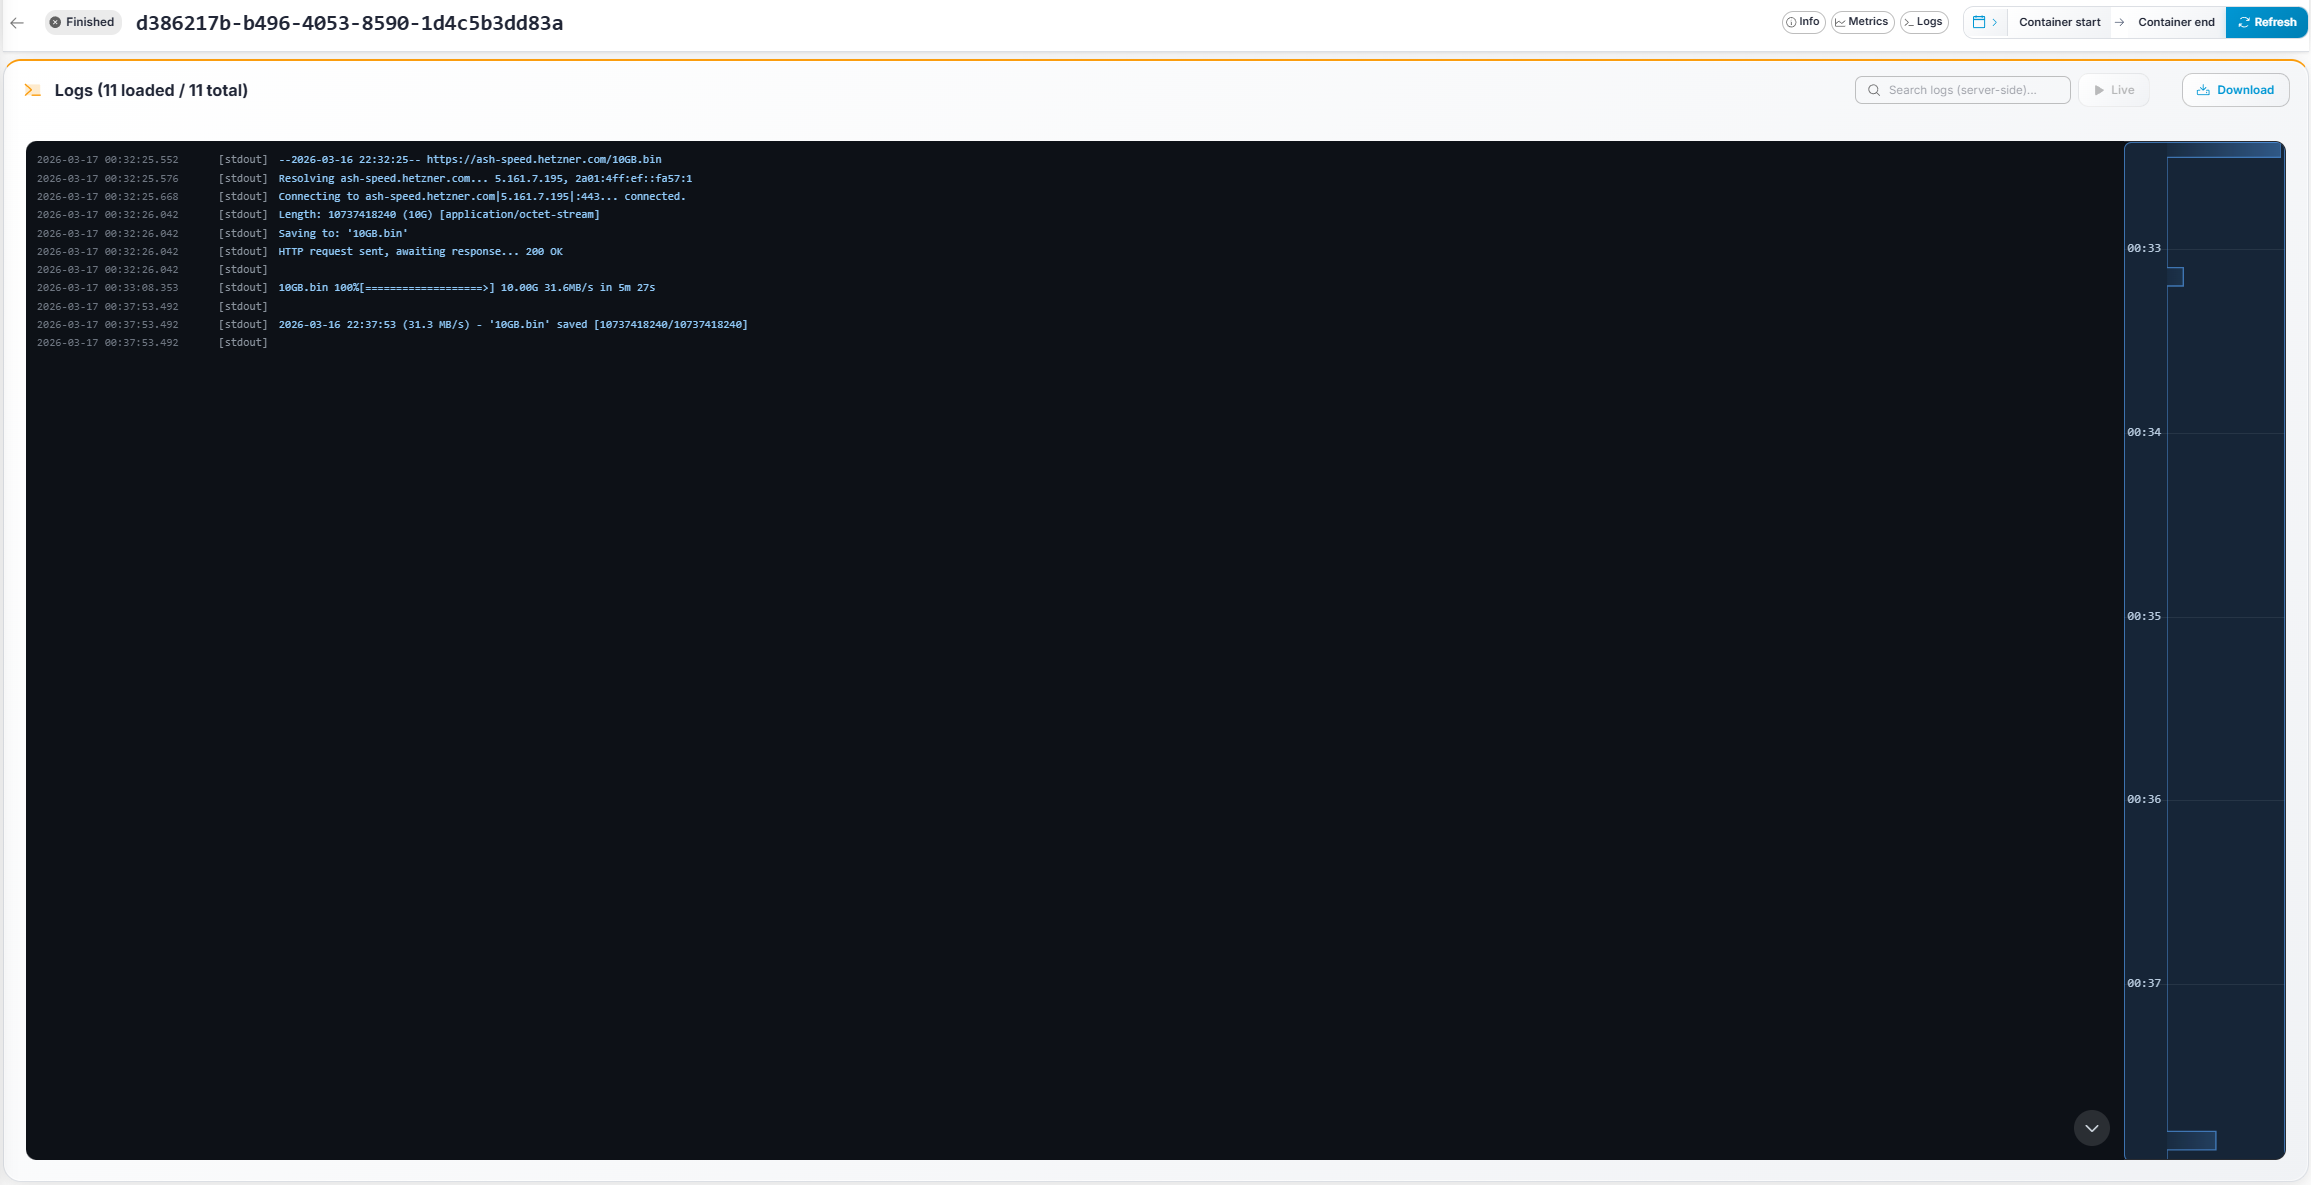
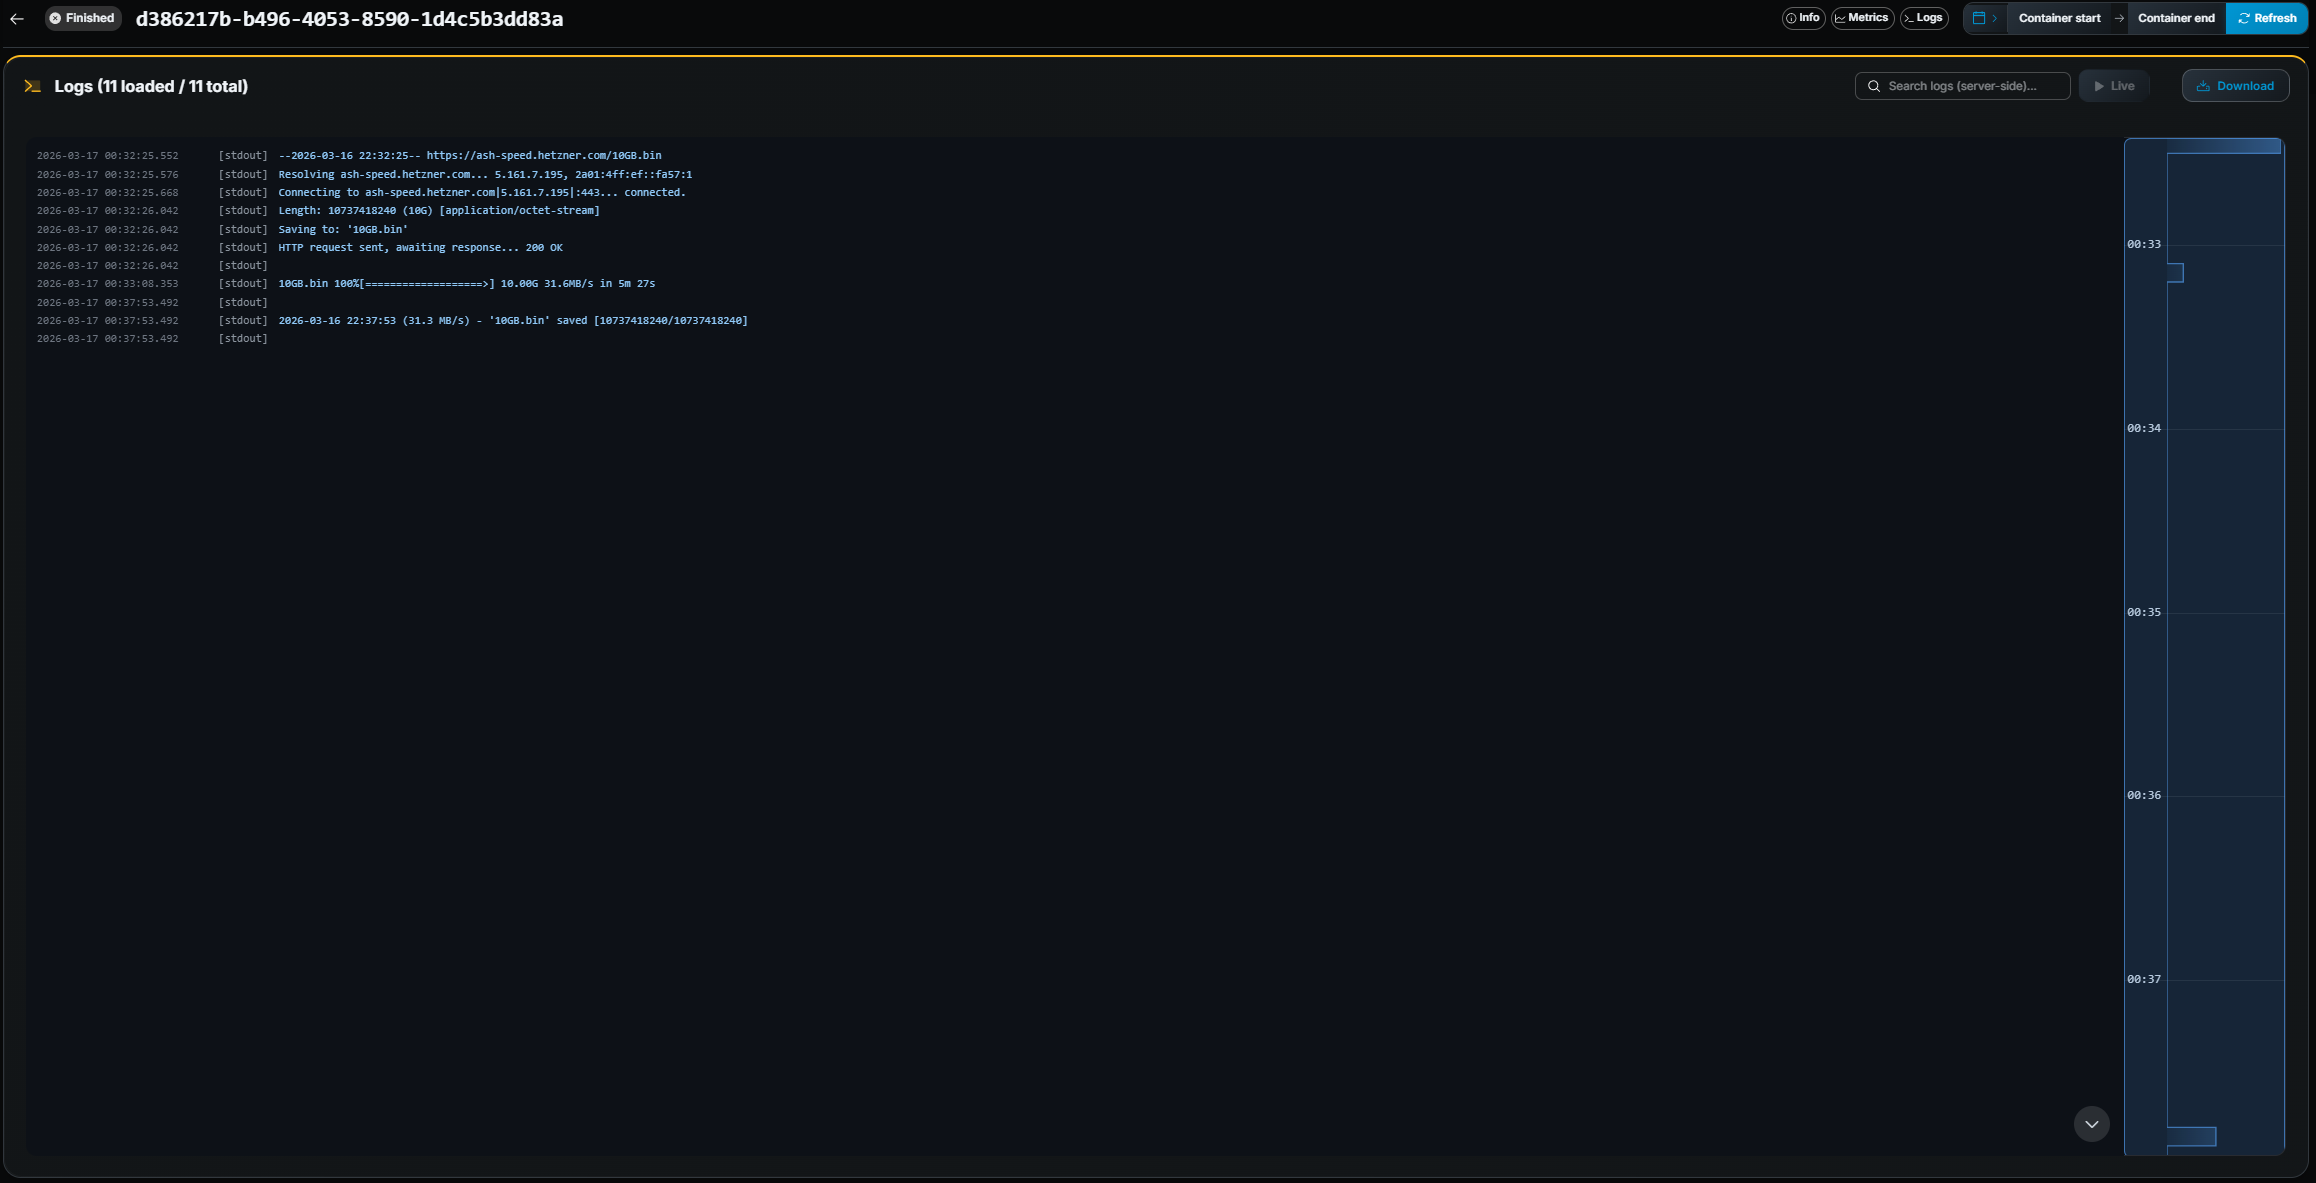
- Server-side search — Type a query in the search field. Matching logs are highlighted and the total count updates.
- ANSI color support — Logs are rendered with full ANSI color codes, so colored output from your game server is displayed correctly.
- Live tail — Click the ▶ Tail button to stream new log lines in real time. The log view auto-scrolls to the bottom. Click ⏸ Pause to stop.
- Infinite scroll — Scroll up to load older log lines, scroll down to load newer lines.
- Download — Click the Download button to download the full log file
(from container start to end) as a
.txtfile. - Log histogram minimap — A small bar chart above the log panel shows log density over time, giving a quick visual overview of when activity occurred.
- New-logs notification — If you scroll up while tailing, a notification shows how many new lines arrived. Click it to jump to the latest.